
Cost Per Impression Calculator
Is your marketing actually making money? Find out in seconds. This straightforward Cost per Impression Calculator helps you measure the effectiveness of any campaign, channel, or initiative. See the direct financial return on your efforts with a clear percentage and profit figure, so you can invest smarter in the strategies that grow your business.
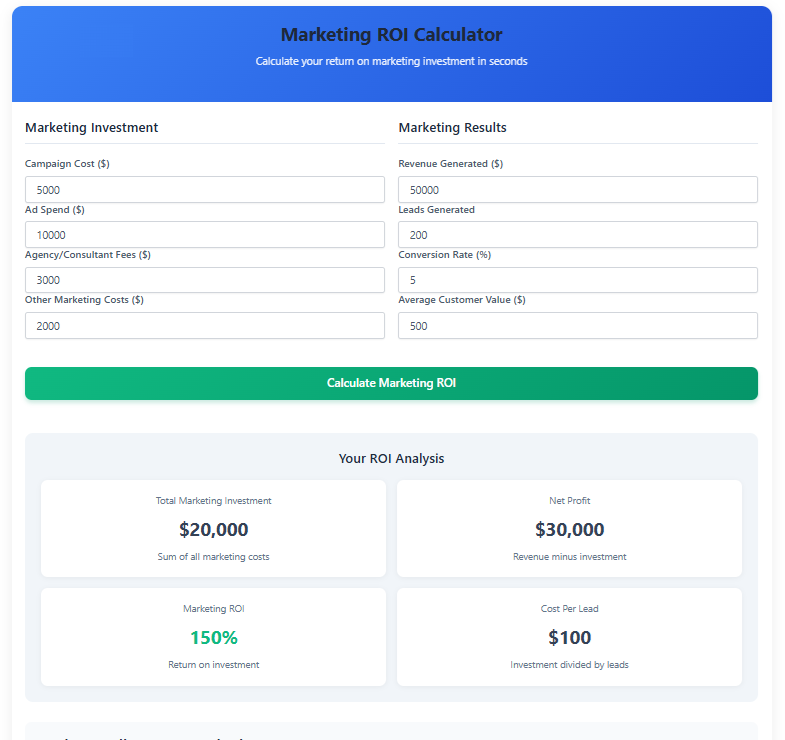
Marketing ROI Calculator
Calculate your return on marketing investment in seconds
Marketing Investment
Marketing Results
Your ROI Analysis
Understanding Your Marketing ROI
ROI (Return on Investment) is calculated as: (Net Profit / Total Investment) × 100%
Net Profit = Revenue Generated - Total Marketing Investment
- Positive ROI: Your marketing generated more revenue than it cost (profitable)
- Negative ROI: Your marketing cost more than it returned (unprofitable)
- Break-even (0% ROI): Revenue exactly equals marketing costs
Use this calculator to evaluate past campaigns or forecast returns for planned marketing activities.
The Ultimate Guide to CPM (Cost Per Mille): Calculator, Benchmarks & Optimization
What Is CPM and Why Is It the Cornerstone of Digital Advertising?
CPM, which stands for Cost Per Mille (the Latin word for “thousand”), is the definitive metric for measuring the cost-efficiency of your advertising reach. It tells you exactly how much you pay for every one thousand impressions—that is, every thousand times your ad is displayed. Whether you’re launching a broad brand awareness campaign or a targeted product promotion, understanding and calculating your CPM is non-negotiable for budget management, campaign evaluation, and competitive analysis.
This guide provides more than just a simple CPM calculator. It delivers the complete strategic framework you need to calculate costs, benchmark performance against real-world industry data, and implement proven optimization tactics that lower your CPM and maximize your return on ad spend (ROAS).
How to Calculate CPM: Formulas and Interactive Examples
The Core CPM Formula
The standard formula for calculating Cost Per Mille is straightforward:
CPM = (Total Campaign Cost ÷ Total Number of Impressions) × 1,000
Let’s break this down with a practical example:
If you spend $2,000 on a campaign that generates 100,000 impressions, your calculation would be:
($2,000 / 100,000) × 1,000 = $20 CPM.
This means you pay $20 for every thousand times your ad was shown.
Versatile Campaign Planning: Calculate Any Variable
A powerful CPM calculator works three ways, allowing you to solve for any missing variable in your campaign plan. Below are the formulas and interactive scenarios.
| Value to Calculate | Formula | Example Scenario |
|---|---|---|
| Total Campaign Cost | Cost = (CPM × Impressions) / 1,000 | You have a $15 CPM and want 250,000 impressions. Your cost = ($15 × 250,000) / 1,000 = $3,750. |
| Number of Impressions | Impressions = (Total Cost × 1,000) / CPM | You have a $5,000 budget and an estimated $25 CPM. Impressions = ($5,000 × 1,000) / $25 = 200,000 impressions. |
| Cost Per Mille (CPM) | CPM = (Total Cost ÷ Impressions) × 1,000 | You spent $1,500 and received 75,000 impressions. CPM = ($1,500 / 75,000) × 1,000 = $20. |
CPI vs. CPM: Understanding the Difference
A related metric is Cost Per Impression (CPI), which is simply the cost of a single impression. The relationship is simple: CPM = CPI × 1,000. If your CPI is $0.008, your CPM is $8. While CPM is the standard for media buying and planning due to more manageable numbers, CPI can be useful for fine-grained financial analysis.
Industry & Platform CPM Benchmarks: Is Your Cost Good?
A “good” CPM is entirely contextual, depending on your industry, target platform, and campaign objectives. Use the following real-world benchmarks to gauge your performance.
CPM Benchmarks by Advertising Platform (2025 Data)
Platform averages vary drastically based on audience competitiveness and ad format.
| Platform | Average CPM Range | Primary Use Case | Key Optimization Lever |
|---|---|---|---|
| TikTok Ads | $4.50 – $7.00 | Upper-funnel engagement & viral reach | Creative quality & view-through rate |
| Meta (Facebook & Instagram) Ads | $6.00 – $12.00 | Full-funnel performance & retargeting | Audience targeting & creative testing |
| YouTube | $4.50 – $10.00 | Brand awareness & video completion | View rate & audience targeting |
| Google Display Network | $2.50 – $6.00 | Broad reach & retargeting | Placement viewability & contextual targeting |
| LinkedIn Ads | $8.00 – $15.00+ | B2B lead generation & professional outreach | Job title/company targeting |
CPM Benchmarks by Industry Vertical
Your industry’s competitive landscape directly impacts costs.
Lower CPM Industries ($5 – $8): Art & Entertainment, Pet Supplies, Home & Garden.
Moderate CPM Industries ($7 – $10): Clothing & Accessories, Food & Drink, Health & Beauty.
Higher CPM Industries ($10+): Sport & Recreation, Technology, Finance (B2B generally commands higher CPMs due to more valuable customer actions).
The 4-Step CPM Optimization Framework
A rising CPM can erode your budget. Follow this actionable, repeatable framework to diagnose issues and improve efficiency.
Step 1: Audit Delivery & Identify Spikes
Check your campaign pacing and placement reports daily. Is your budget burning too fast on specific days, times, or websites? A sudden CPM spike often indicates increased competition for your targeted audience or placement. Use this data to adjust dayparting or pause underperforming placements.
Step 2: Segment Performance by Audience & Creative
Break down your CPM by every targeting layer (demographics, interests, custom audiences) and by each ad creative. You will often find pockets of high efficiency and others of high cost. This allows you to reallocate budget from high-CPM segments to low-CPM, high-performing ones.
Step 3: Run Structured A/B Tests
Continuously test new variables to improve engagement, which can lead to better auction prices and lower CPMs. Focus on one element at a time:
Creative: Test different hooks, value propositions, and video vs. static imagery.
Copy: Test headline variations and call-to-action (CTA) phrasing.
Audience: Test slightly broader or narrower interest sets.
Step 4: Rebalance Budget Towards Winners
After testing and segmentation, decisively shift your budget. Increase spend on the winning combinations of low-CPM audiences and high-engagement creatives. Pause or significantly reduce spend on consistently high-CPM segments that don’t drive downstream conversions.
Real-World Optimization Result: One Meta Ads campaign reduced its CPM from over $30 to $16 by splitting campaigns by funnel stage, refreshing ad creatives, and removing audience overlap. This maintained consistent impressions while dramatically improving cost efficiency.
Beyond CPM: Essential Metrics for a Complete Picture
While CPM measures reach efficiency, it must be analyzed alongside performance metrics to get the full story.
| Metric | What It Measures | Why It Matters with CPM |
|---|---|---|
| CTR (Click-Through Rate) | (Clicks ÷ Impressions) × 100 | A low CTR with a low CPM might mean cheap but irrelevant impressions. A high CTR validates your targeting and creative. |
| CPC (Cost Per Click) | Total Cost ÷ Total Clicks | Calculate this to see the true cost of traffic. CPC = (CPM ÷ 1000) ÷ CTR. A low CPM with a terrible CTR can still yield a high CPC. |
| CPA (Cost Per Acquisition) | Total Cost ÷ Total Conversions | The ultimate metric for performance campaigns. Your goal is to optimize CPM and CTR to drive down your final CPA. |
| Viewability Rate | % of impressions actually seen | Industry standard is 70%+. A low CPM is meaningless if 50% of your ads are never seen. |
Frequently Asked Questions (FAQ)
What’s more important: a low CPM or a high CTR?
Neither should be viewed in isolation. The optimal balance depends on your goal. For pure brand awareness, a low CPM might be priority. For driving traffic or sales, you need a sufficiently high CTR and relevant conversion rate, even if it means accepting a moderately higher CPM.
How often should I refresh my ad creatives to maintain CPM?
Plan to refresh ad creatives every 2 to 4 weeks, or when your frequency (average impressions per user) exceeds 4-5. Ad fatigue leads to lower engagement, which can cause platforms to increase your CPM.
Why does my CPM fluctuate daily?
CPM is set by real-time auctions. Daily fluctuations are normal due to changes in inventory supply (e.g., fewer people online), audience competition (e.g., more brands targeting your demographic), and the perceived quality of your ad. Focus on weekly trends rather than daily changes.
Cost Per Impression Calculator: Your Complete FAQ Guide
Understanding Cost Per Impression Calculations
What is a cost per impression calculator and how does it work?
A cost per impression calculator is a digital tool that helps advertisers determine the expense of showing their ads to potential customers. It calculates either CPI (Cost Per Impression) for single ad views or CPM (Cost Per Mille) for thousand-impression blocks. These calculators use the fundamental formula: Cost Per Impression = Total Campaign Cost ÷ Total Impressions. Advanced calculators also work in reverse, helping you plan budgets based on desired impressions or estimate impressions from fixed budgets.
How accurate are online cost per impression calculators?
Our cost per impression calculator provides mathematically precise calculations based on standard advertising formulas. However, actual campaign costs depend on dynamic auction markets, targeting parameters, ad quality scores, and seasonal competition that no calculator can perfectly predict. For planning purposes, consider calculator results as estimates within 15-25% of actual costs, with more variance in highly competitive niches or during peak seasons.
What’s the difference between calculating CPI and CPM manually versus using a cost per impression calculator?
Manual calculation requires you to:
Track total campaign spend
Count total impressions delivered
Apply formulas: CPI = Cost ÷ Impressions and CPM = (Cost ÷ Impressions) × 1,000
A dedicated cost per impression calculator automates this process, reduces human error, allows reverse calculations (finding budget needed for target impressions), and often includes benchmark comparisons. For frequent advertisers, using a calculator saves time and improves accuracy when planning multiple campaigns.
Using Cost Per Impression Calculators Effectively
What information do I need to use a cost per impression calculator?
To get meaningful results from any cost per impression calculator, gather:
Total advertising budget (or desired maximum spend)
Target number of impressions (or estimated reach)
Industry vertical (for benchmark comparisons)
Platform selection (Facebook, Google, etc., as CPM varies significantly)
Campaign timeframe (seasonality affects costs)
With just budget and impression goals, our calculator can determine your estimated CPI/CPM. With current CPM data, it can predict potential impressions for your budget.
Can a cost per impression calculator help me compare platforms?
Yes, advanced cost per impression calculators include platform-specific benchmarks. For example:
Social media platforms (Facebook/Instagram): $8-25 CPM
Programmatic display: $3-10 CPM
Video platforms (YouTube): $6-20 CPM
Search engines: $10-50+ CPM (though usually CPC-based)
By entering your target impressions, our calculator shows estimated costs across different platforms, helping you allocate budget efficiently.
How can I use a cost per impression calculator to plan my advertising budget?
Follow these steps for effective budget planning:
Define objectives: Awareness (focus on impressions) vs. conversions (balance with other metrics)
Input industry benchmarks or use our calculator’s built-in averages
Test scenarios: Adjust impression goals to see cost changes
Compare platforms: See where your budget stretches furthest
Add buffer: Include 15-20% extra for auction price fluctuations
Our cost per impression calculator lets you manipulate all variables to find the optimal balance between reach and cost.
Advanced Applications & Interpretation
Why do I get different results from various cost per impression calculators?
Discrepancies between cost per impression calculator tools stem from:
Different benchmark data sources: Some use global averages, others platform-specific data
Varying fee assumptions: Some include platform fees, others show just media cost
Geographic adjustments: Automatic location-based pricing adjustments
Timeframe considerations: Real-time vs. historical average data
For consistency, use one calculator for all projections and verify its assumptions match your actual advertising conditions.
How do I calculate related metrics using a cost per impression calculator?
Our comprehensive cost per impression calculator also helps determine:
CPC from CPM: CPC = CPM ÷ (CTR × 1000)
Budget requirements: Budget = (CPM × Desired Impressions) ÷ 1000
Impression estimates: Impressions = (Budget × 1000) ÷ CPM
ROI projections: When combined with conversion rate and average order value
This multifunction approach makes it more valuable than simple single-purpose calculators.
What limitations should I know about when using a cost per impression calculator?
Every cost per impression calculator has inherent limitations:
Cannot predict auction dynamics in real-time bidding environments
Assumes average performance rather than your specific ad quality
May not account for audience size limitations or saturation effects
Seasonal fluctuations can dramatically alter actual versus projected costs
New platform algorithms or policy changes aren’t immediately reflected
Use calculator results as directional guidance rather than absolute guarantees.
Optimization Strategies Using Calculator Insights
How can cost per impression calculator results help me negotiate better rates?
When working with direct publishers or in guaranteed placement scenarios, use cost per impression calculator data to:
Establish market-rate baselines for negotiation starting points
Compare platform performance to justify budget allocations
Demonstrate historical cost patterns when discussing long-term contracts
Identify premium percentages you’re paying for specific placements
Arm yourself with calculated benchmarks before rate discussions.
What should I do if my actual costs differ significantly from cost per impression calculator projections?
If discrepancies exceed 25-30%:
Verify targeting parameters: Overly narrow audiences increase costs
Check ad quality scores: Poor-performing ads cost more
Analyze seasonality: Holiday periods inflate prices
Review placement mix: Premium inventory costs more
Assess competitive landscape: New entrants can drive up auction prices
Use our cost per impression calculator to model adjusted scenarios based on these findings.
How often should I use a cost per impression calculator for ongoing campaigns?
Regular usage schedule:
Planning phase: Daily while establishing initial projections
Active campaigns: Weekly check-ins against actual performance
Platform changes: Whenever testing new networks or formats
Budget revisions: Before increasing or reallocating spend
Seasonal planning: Quarterly for upcoming season projections
Bookmark our cost per impression calculator for regular access during these critical decision points.
Industry-Specific Considerations
Do cost per impression calculators account for industry variations?
Quality cost per impression calculator tools include industry adjustments since CPM varies dramatically:
Financial/legal services: $15-40+ CPM
E-commerce/retail: $8-20 CPM
Travel/hospitality: $6-15 CPM (seasonally variable)
Gaming/apps: $4-12 CPM
B2B technology: $10-30+ CPM
Our calculator includes industry presets that automatically adjust benchmarks based on your vertical.
How do geographic factors affect cost per impression calculator results?
Location impacts costs through:
Market maturity: Developed countries have higher CPMs
Competition density: Urban areas typically cost more
Local purchasing power: Affects what advertisers will pay
Mobile vs. desktop dominance: Varies by region
For multi-country campaigns, use a cost per impression calculator that allows geographic segmentation or calculate each market separately.
Can I use a cost per impression calculator for offline media planning?
While designed for digital, the principles apply to:
Traditional print: Cost ÷ circulation estimates
Outdoor advertising: Cost ÷ estimated views
TV/radio: Cost ÷ reach estimates
However, offline impression estimates are less precise, so apply larger variance buffers (30-50%) when using a cost per impression calculator for traditional media.
Need precise calculations for your next campaign? Use our interactive cost per impression calculator above to model different scenarios, or contact our advertising analysts for a personalized media plan based on your specific objectives and market conditions.